Viewing
The viewing interface is implemented following the Web Map Tile Service (WMTS) as well as the Web Map Service (WMS) standards. Both services are implemented by a wide range of client software which makes it as simple as possible to integrate the viewing service as needed.
Service endpoints optimized for performance as well as for flexibility are provided alongside each other. Concrete example URLs demonstrating the capabilities of the various endpoints are provided in the chapter Sample Service Requests.
Performance optimized service
The performance optimized service variant is provided under the path
/cache/ows?.
This endpoint offers access to predefined visualizations via WMTS and WMS. The GetTile as well as GetMap requests are answered from image tiles cached on object storage when possible. Figure 28 below shows the three predefined visualizations, true color, false color, and NDVI of the same image tile and Figure 29 the unmasked and masked versions using the validity mask of one tile.
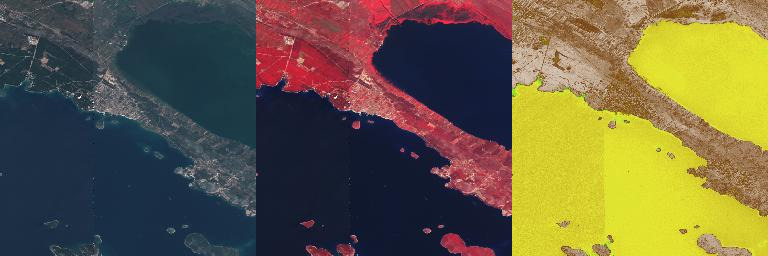
Figure 28 WMTS Tiles - True color, false color, and NDVI
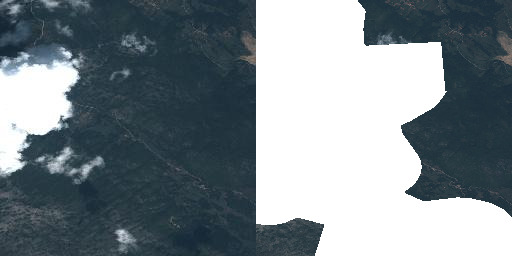
Figure 29 WMTS Tiles - Unmasked and masked
The operator might configure additional layers besides the default ones. These layers can offer a specific customization described below as performance optimized variant.
For example for the VHR Image 2018 dataset not only the three default layers for True Color, False Color, and NDVI are configured but also the Masked Validity one as shown in the figures above.
In addition the VHR Image 2018 dataset contains level 1 and 3 products. Thus individual layers aggregating each level individually are added making the total of offered layers twelve.
Finally two layers are configured offering a quick true color visualization of the entire level 3 datasets without support of the time dimension both unmasked as well as masked. The masked layer is shown in Figure 30 below.
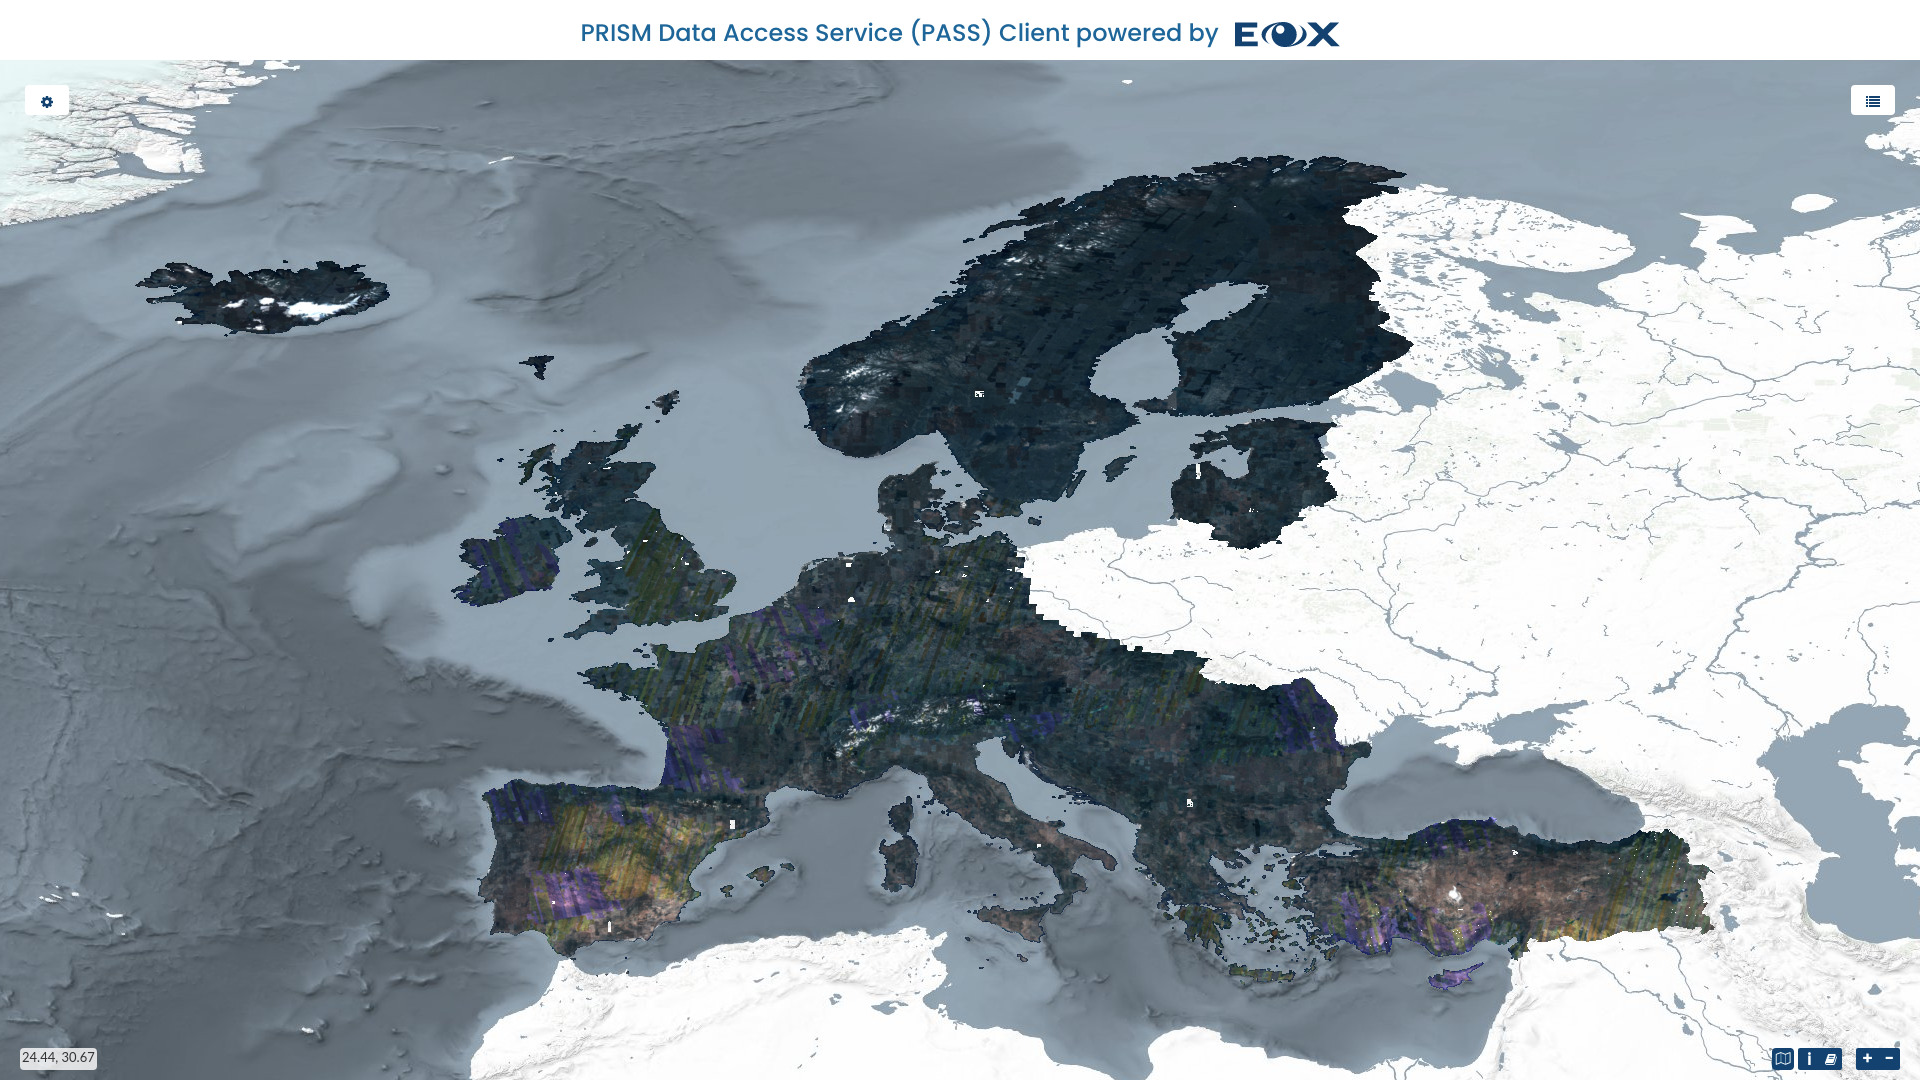
Figure 30 Web Client - Full coverage layer
Image tiles not yet present in the cache are stored upon first hit for consecutive requests. This is the so-called on-demand caching. The operator might decide for optimal performance, even for the first request, to pre-seed the cache. Also a mixed variant with a partly pre-seeded cache for example up to a certain zoom level is possible.
However, this is done fully transparent to the users and the only impact is that they might need to wait slightly longer when they are the first to visualize a certain product.
This service offers access on collection level only. Individual products can be
addressed using the time parameter given that they do not cover one another
on the time axis.
The best performance is offered at the WMTS interface which serves images tiles as they are cached without the need of any reprocessing. WMS responses are generated on-the-fly from image tiles and might thus need some reprocessing to stitch together and scale image tiles.
More sophisticated reprocessing like reprojection or custom color adjustments are not offered at this endpoint.
Flexible service
The other service variant offered is optimized for the best possible flexibility
and can be accessed at the path /ows?.
This endpoint offers the following customizations via WMS:
Access to individual products via ID (
cql=identifier='ID')Access to entire collections/datasets supporting
timeparameterVarious layers as defined by the Earth Observation Application Profile of WMS (EO-WMS) like one showing outlines of products (
__outlines)Additional useful layers like one showing both, products and outlines, correctly rendering topology of outlines (
__outlined) or one showing a validity mask (__validity) or applied validity mask (___masked_validity)Numerous styles for layer where feasible like outlines or NDVI (
layers=ID__NDVI&STYLES=coolwarm)Reprojection to operator configured coordinate reference systems
Color adjustment via custom linear stretch
dim_range=<low-red-or-grey>
<high-red-or-grey>[,<low-green> <high-green>,<low-blue> <high-blue>]
Filtering of products to render into collection/dataset visualizations via Common Query Language (CQL) for example
&cql=cloudCover<1All other standard WMS parameters like
transparent,format, etc.
All these customization parameters can of course be combined as needed.
Please see the chapter Sample Service Requests for detailed examples of all supported parameters.
Loading in QGIS
Any of the above described layers can be loaded in client software supporting either the WMTS or WMS standard like for example QGIS.
Open the Data Source Manager as shown in Figure 31 and create a new WMS/WMTS Connection using the URL to the layer of interest.
When using parameters like for example cql=identifier='ID' to view one
individual product make sure to tick the “Ignore GetMap/GetTile URI reported in
capabilities” as these parameters are overwritten otherwise.
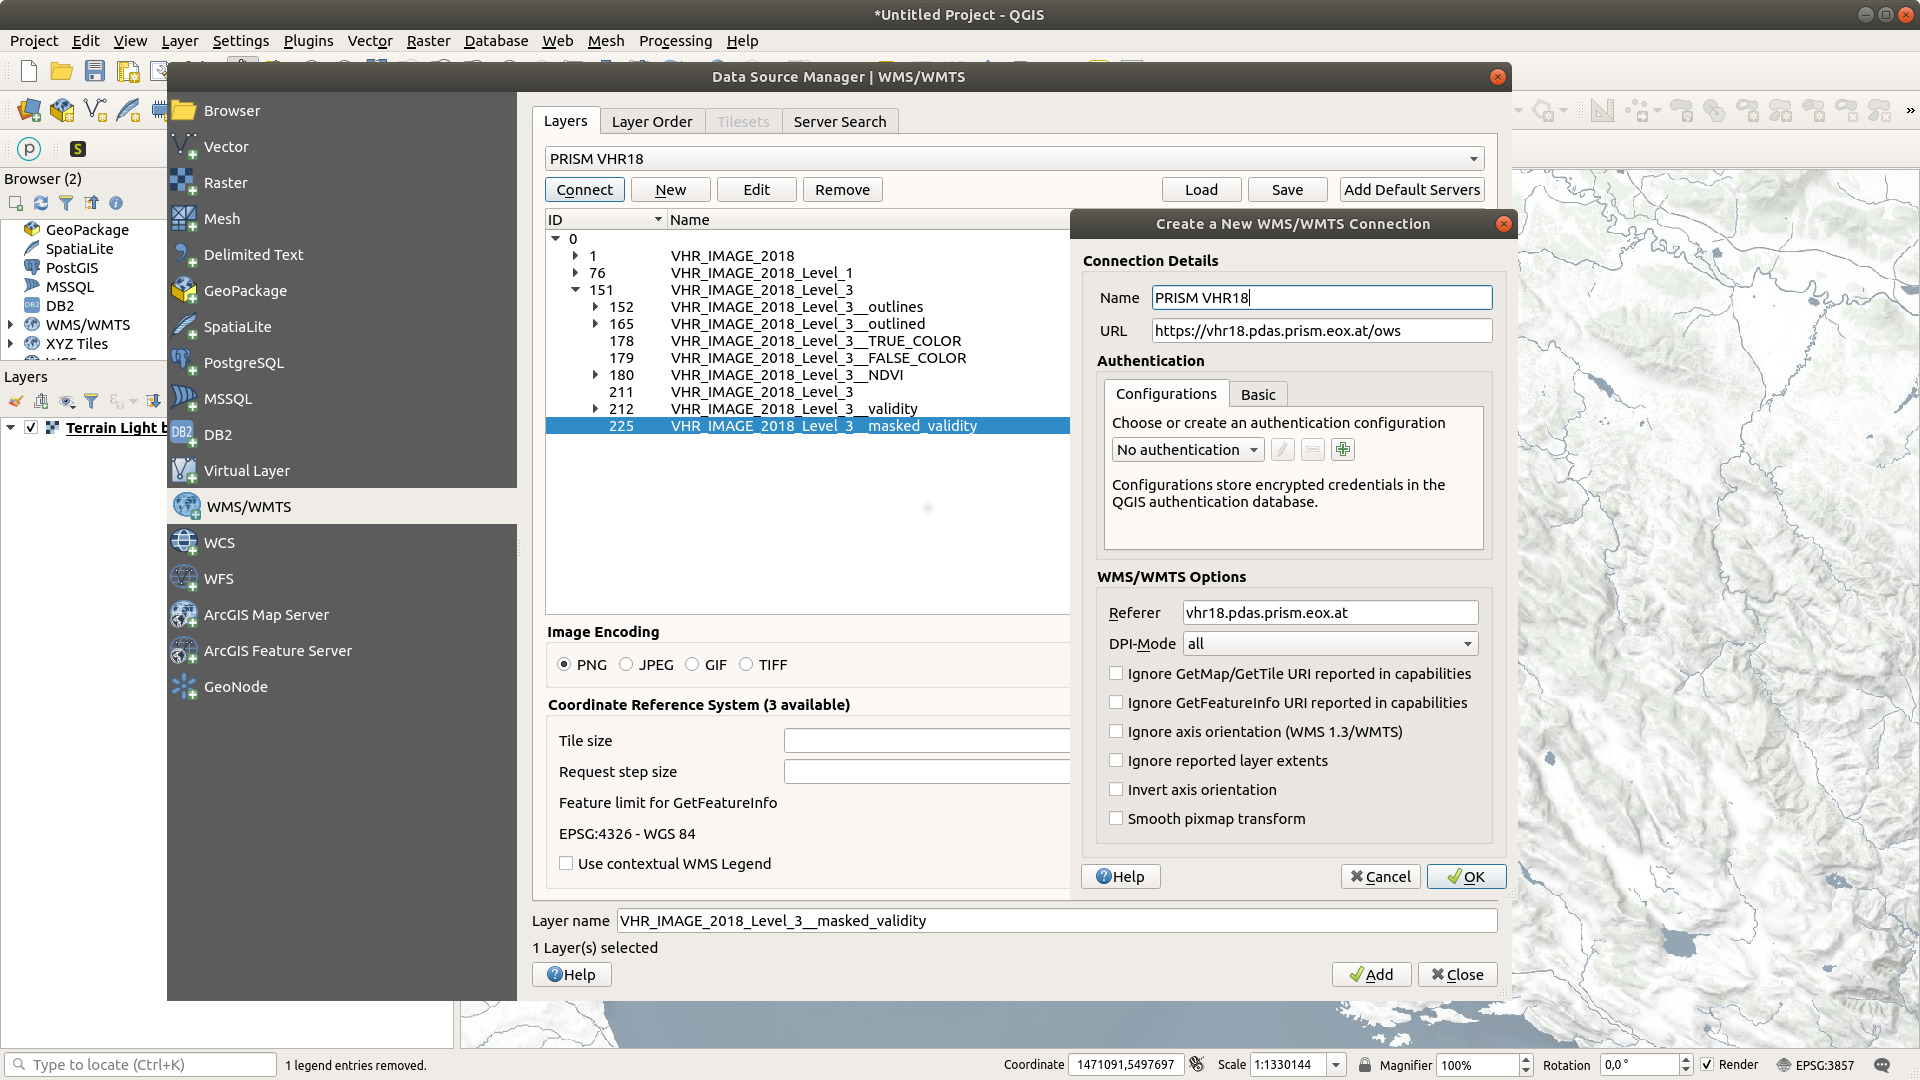
Figure 31 QGIS - Create WMS/WMTS Connection
A login window may appear to access the data. The basic authentication credentials should be entered here.
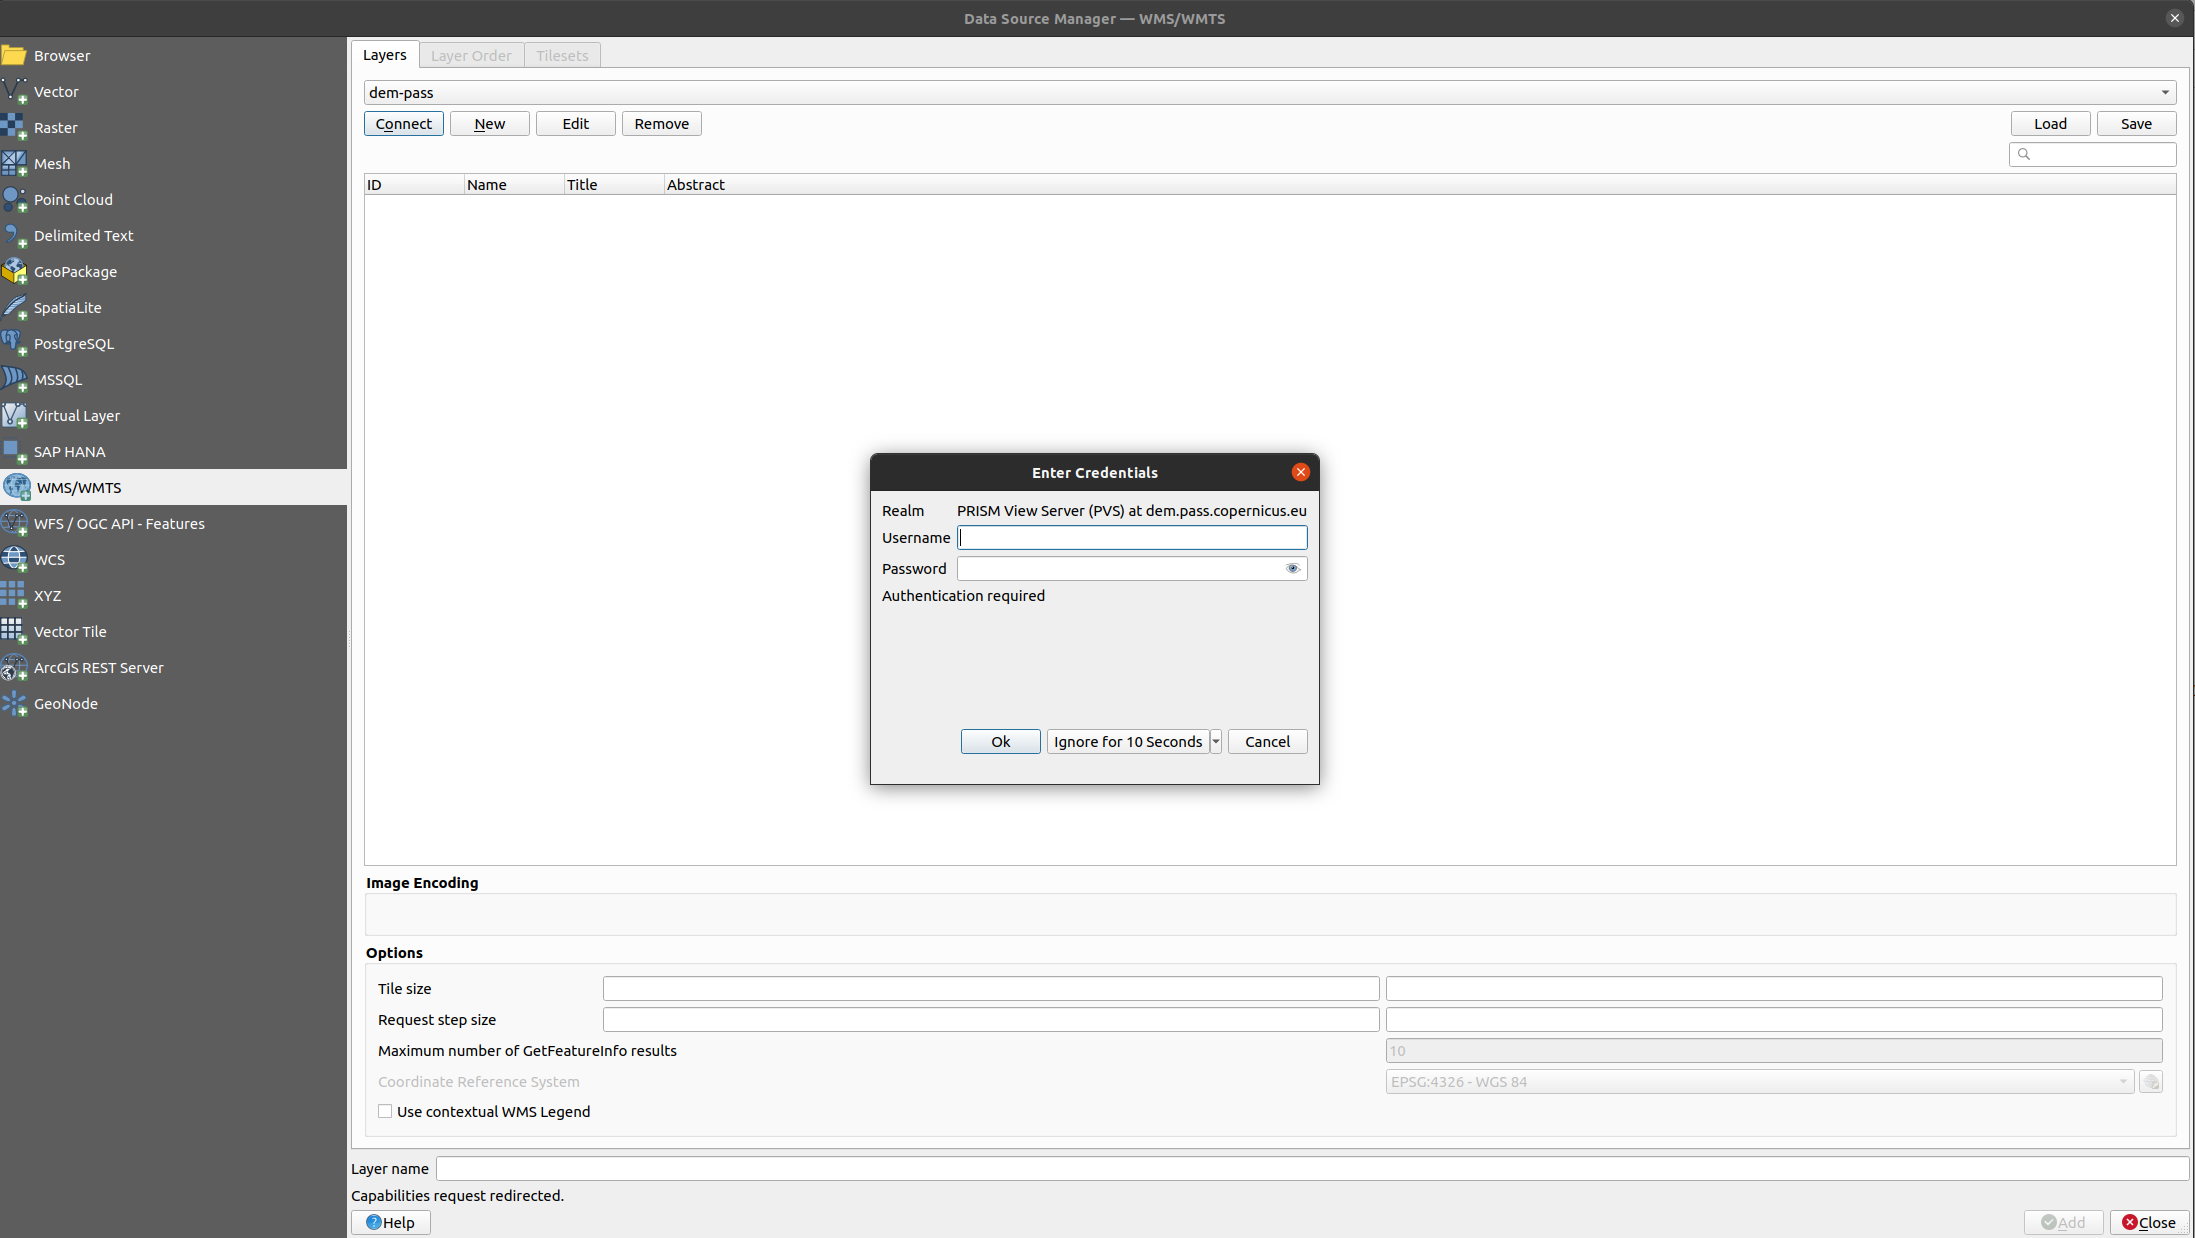
Figure 32 Login window
The next step is to retrieve the capabilities of the created WMS/WMTS Connection using the Connect button. Selected layers from the list are added using the Add button as shown in Figure 33.
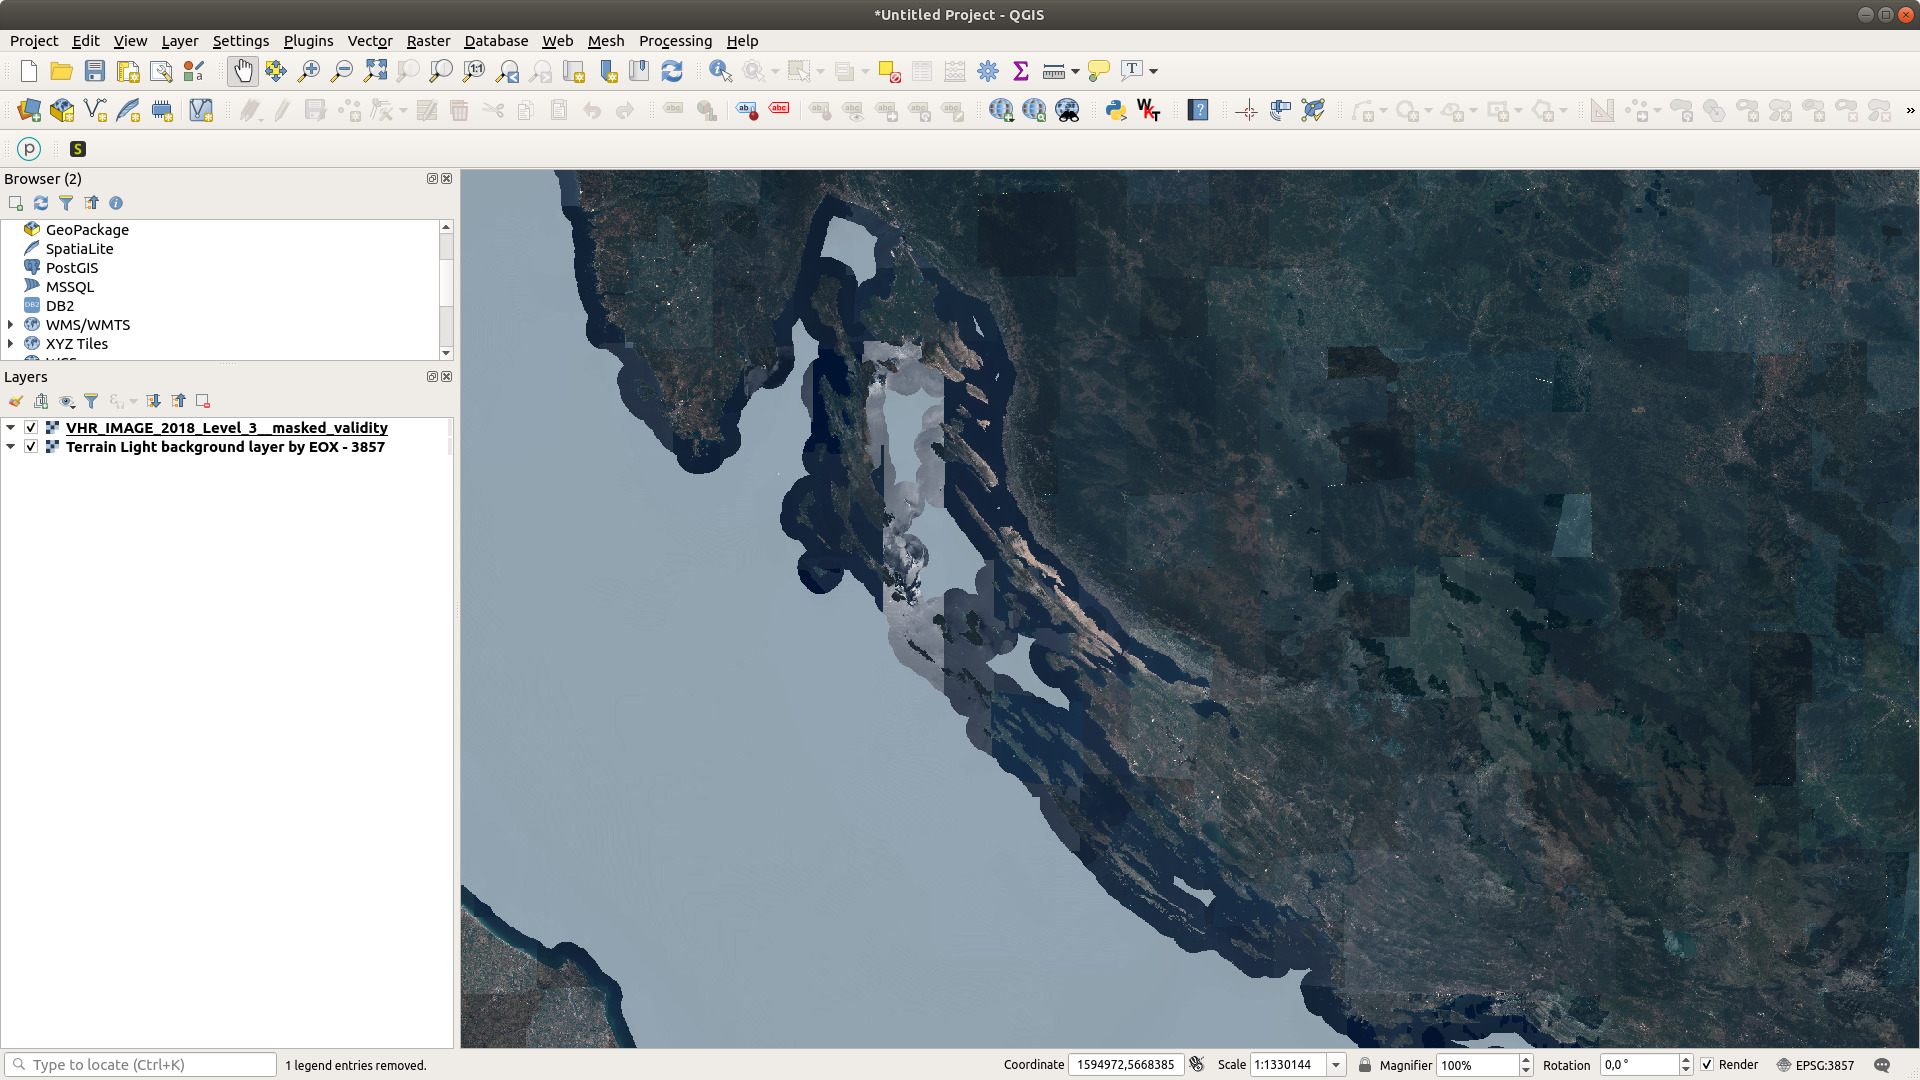
Figure 33 WMS loading in QGIS
Some layers offer styles. In Figure 34 the jet colorbar is selected. Additionally you can specify Tile size to 256x256 for partial loading.
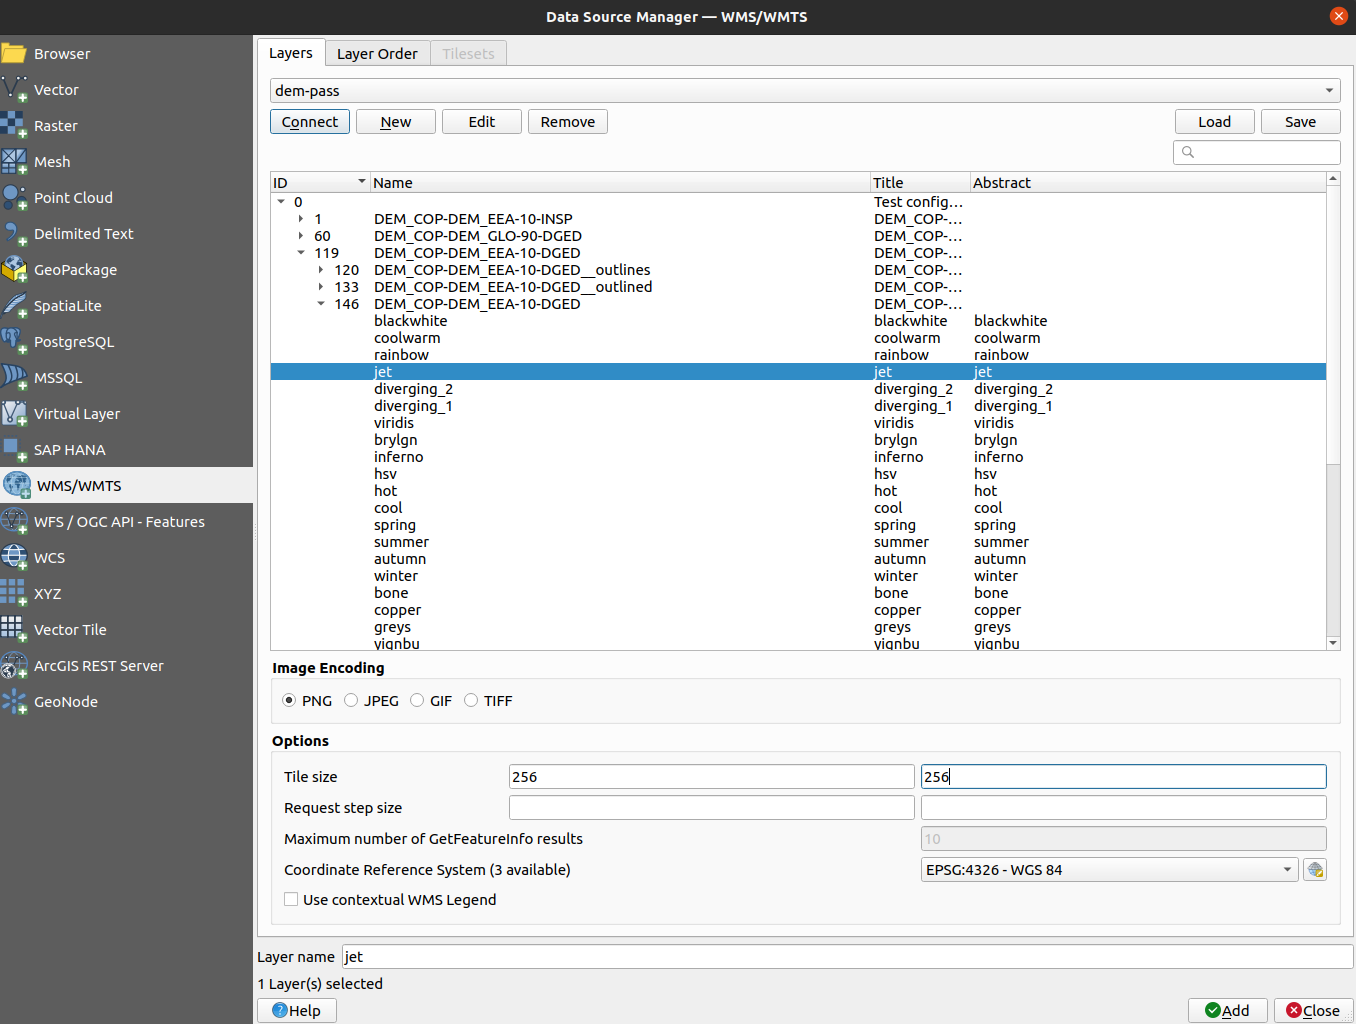
Figure 34 Styles and parameters
An important parameter to consider while viewing the layers is the requested time interval, allowing for example to observe changes over years. One option is to manually add a custom time= parameter to the URL after checking the Ignore GetMap URI checkbox.
For QGIS versions lower than 3.14, the only way how to use WMS layers with time support (WMS-T) is through a maintained plugin called TimeManager. It offers a convenient way to navigate through the time for raster and vector layers with custom defined steps as shown in Figure 35.
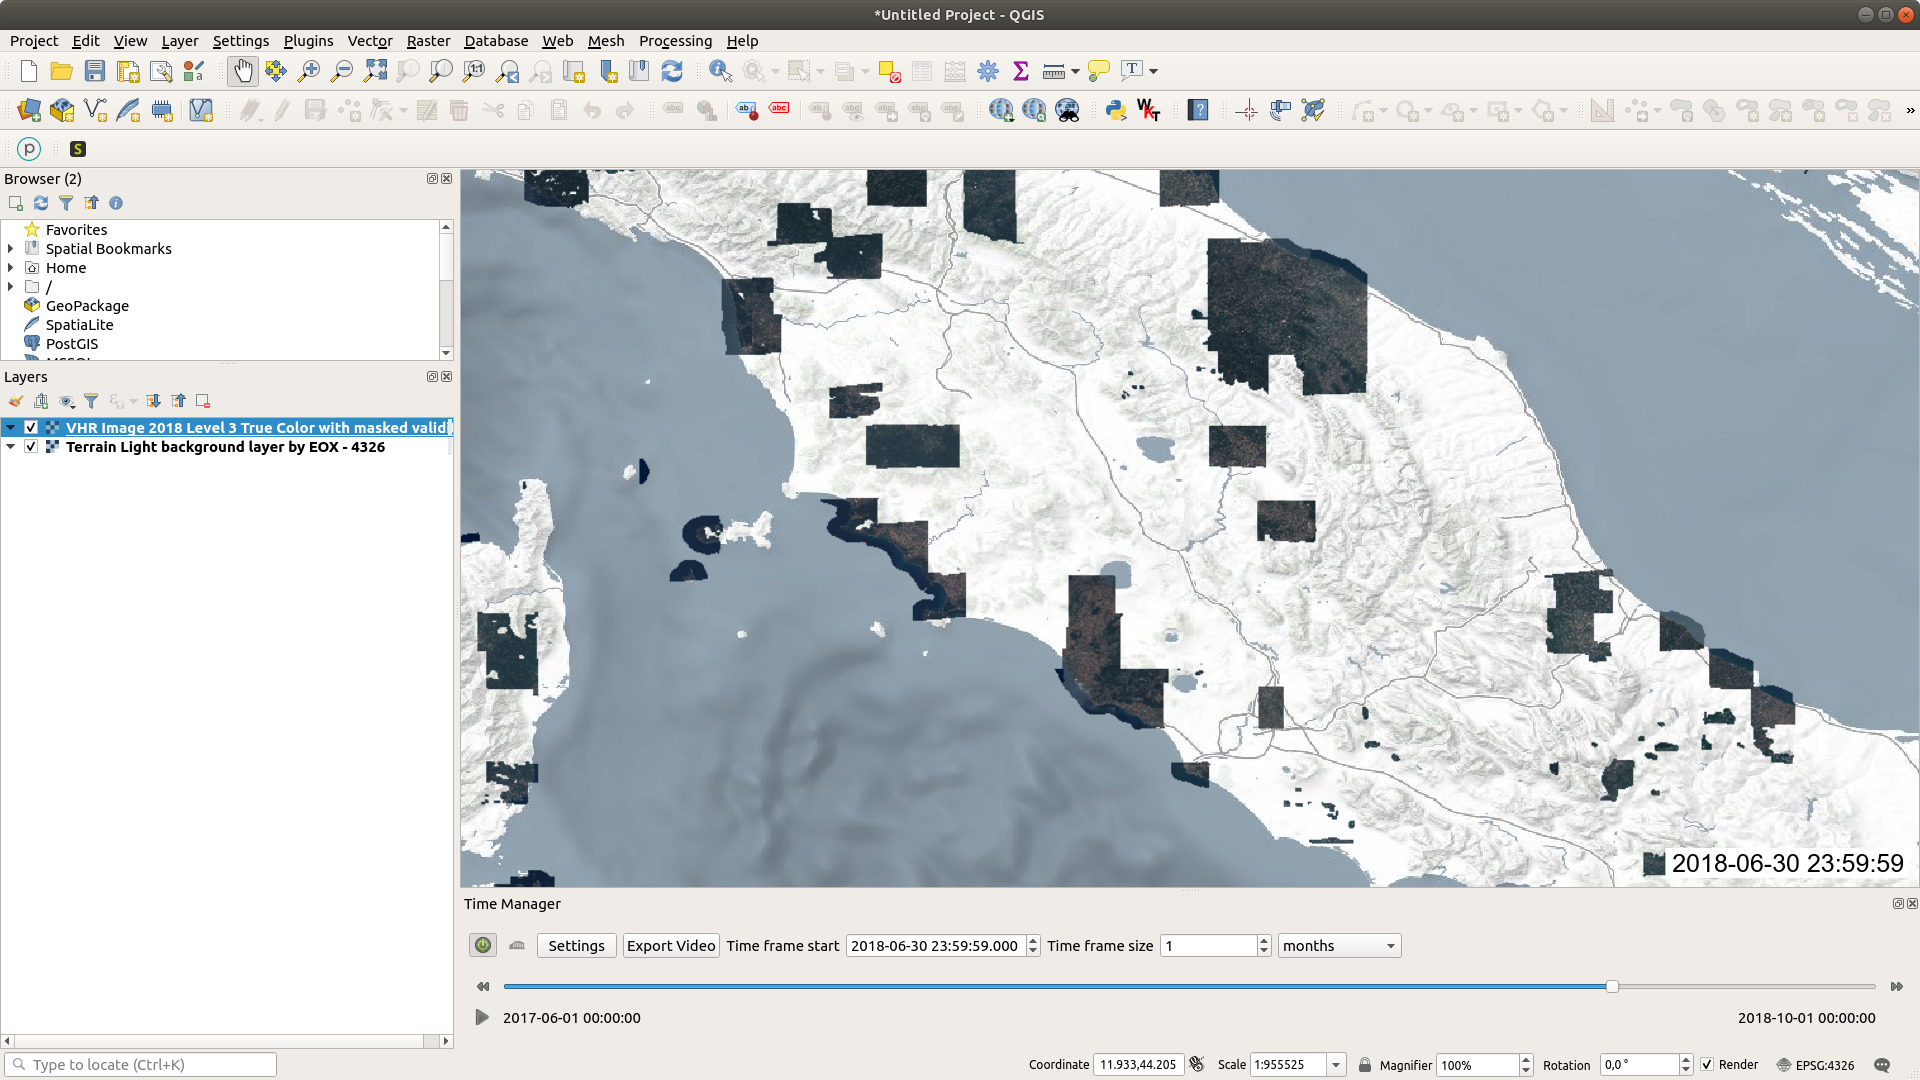
Figure 35 WMS loading in QGIS with TimeManager
The plugin needs to be installed first and then set up with the desired layer. The raster layer to be added to the TimeManager must be first added to the workspace as shown in Loading in QGIS. By clicking the Settings button and following up with the Add raster button as can be seen in Figure 36 it can be then chosen from the list of layers. It is also suggested to add Start and End time constrains to narrow down the interval which TimeManager will consider.
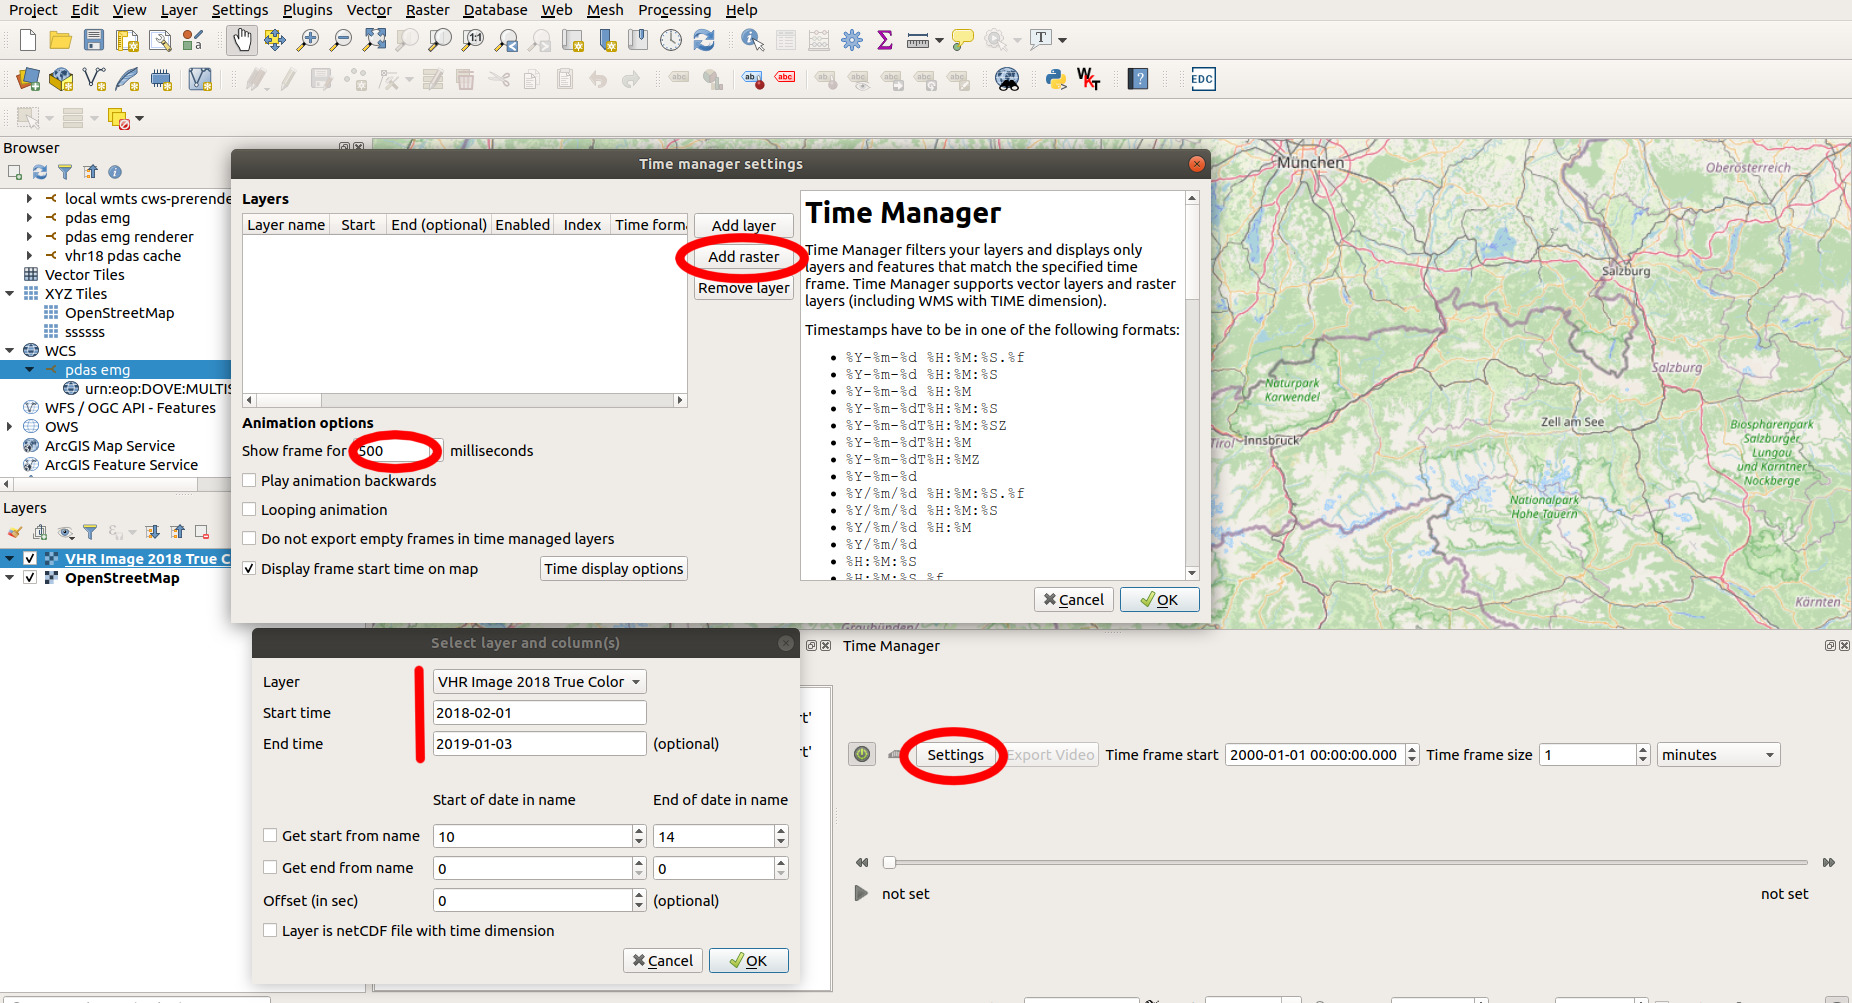
Figure 36 Setup of TimeManager
After setting the layer up, it is possible to change the time interval length (for example one month) and view all products in that interval. After clicking the play button, it displays the layer iteratively from the defined Start time to the defined End time, always displaying each frame for a set number of milliseconds.
It even allows exporting an animation as shown in Figure 37 below.
Figure 37 GIF animation created from TimeManager
New support for time aware layers was added in QGIS Version 3.14 called Temporal Controller. This video directly from the author of the feature shows the usage. However, due to the way that Capabilities of layers are provided by both View Server components Cache and Renderer, the QGIS Temporal Controller can not parse the time dimension metadata correctly.
When a layer with a temporal dimension is loaded it will have temporal options available via the properties, and can be manipulated with the Temporal Controller. The Temporal Controller can be initialized with Right Click on the Panels > Temporal Controller.
In the Temporal Controller the time range can be set and the temporal bar can be moved to the desired date and the data loaded corresponds to the date selected.
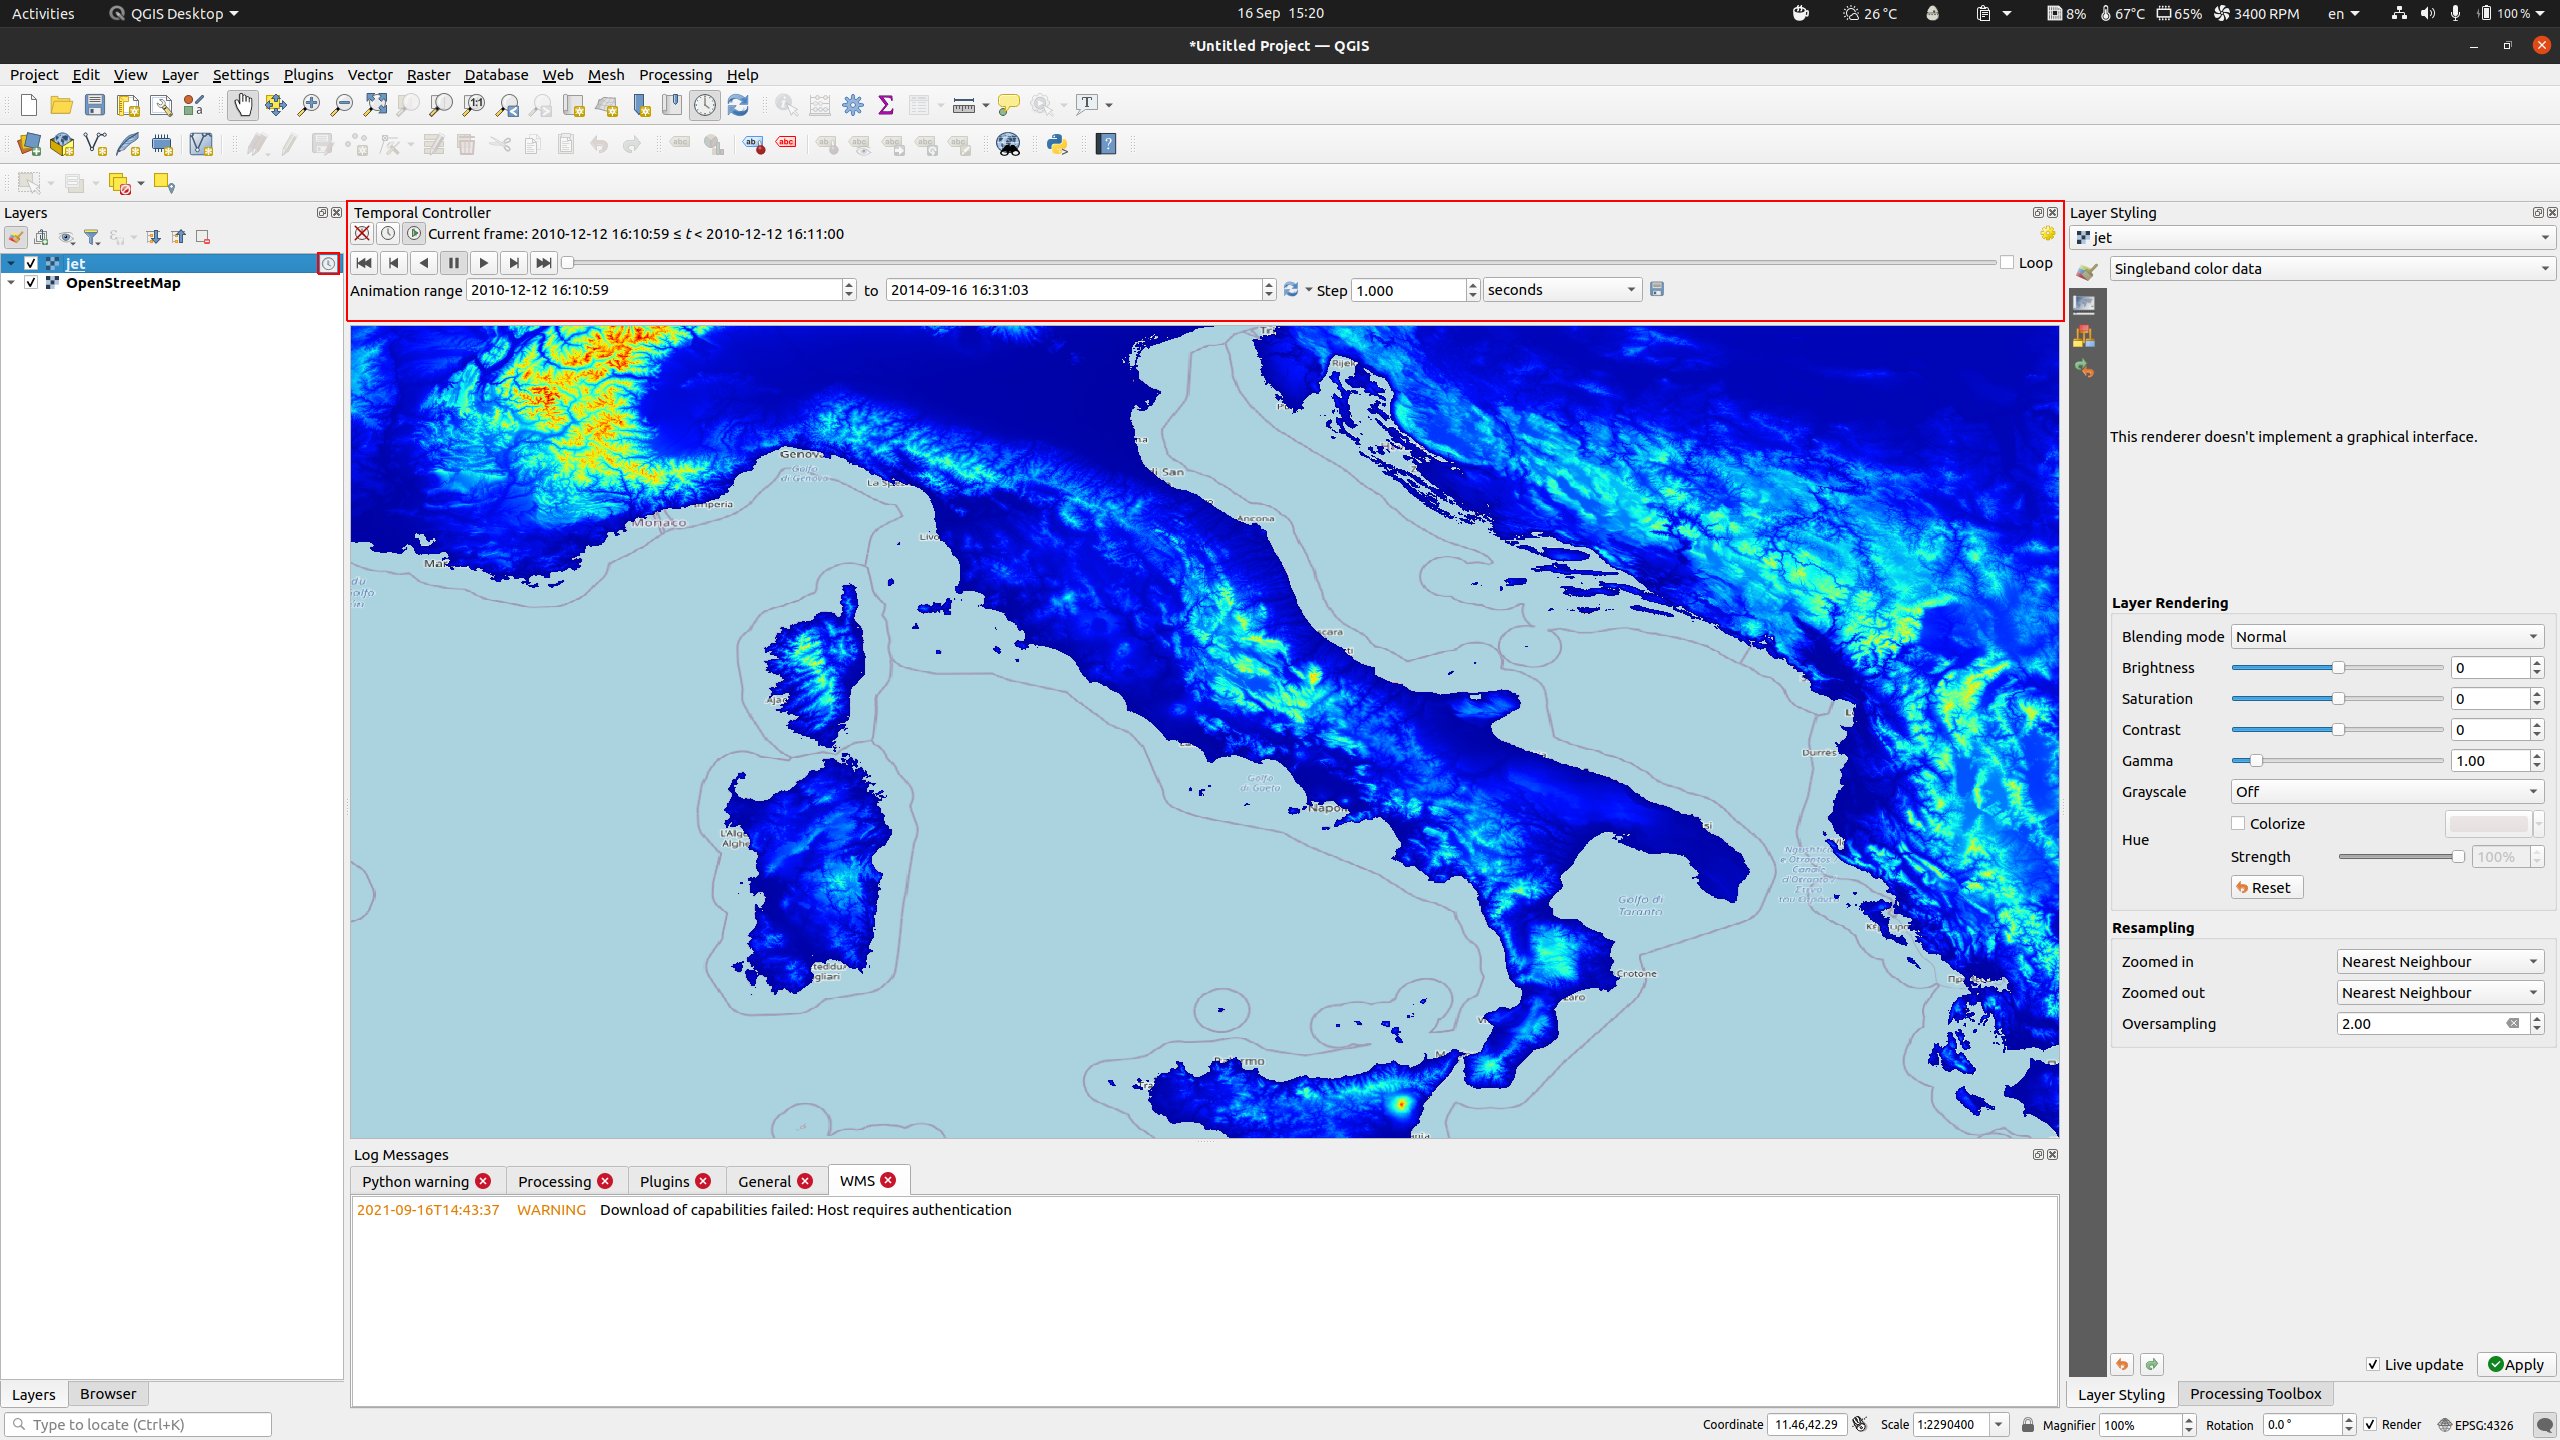
Figure 38 Time Controller panel
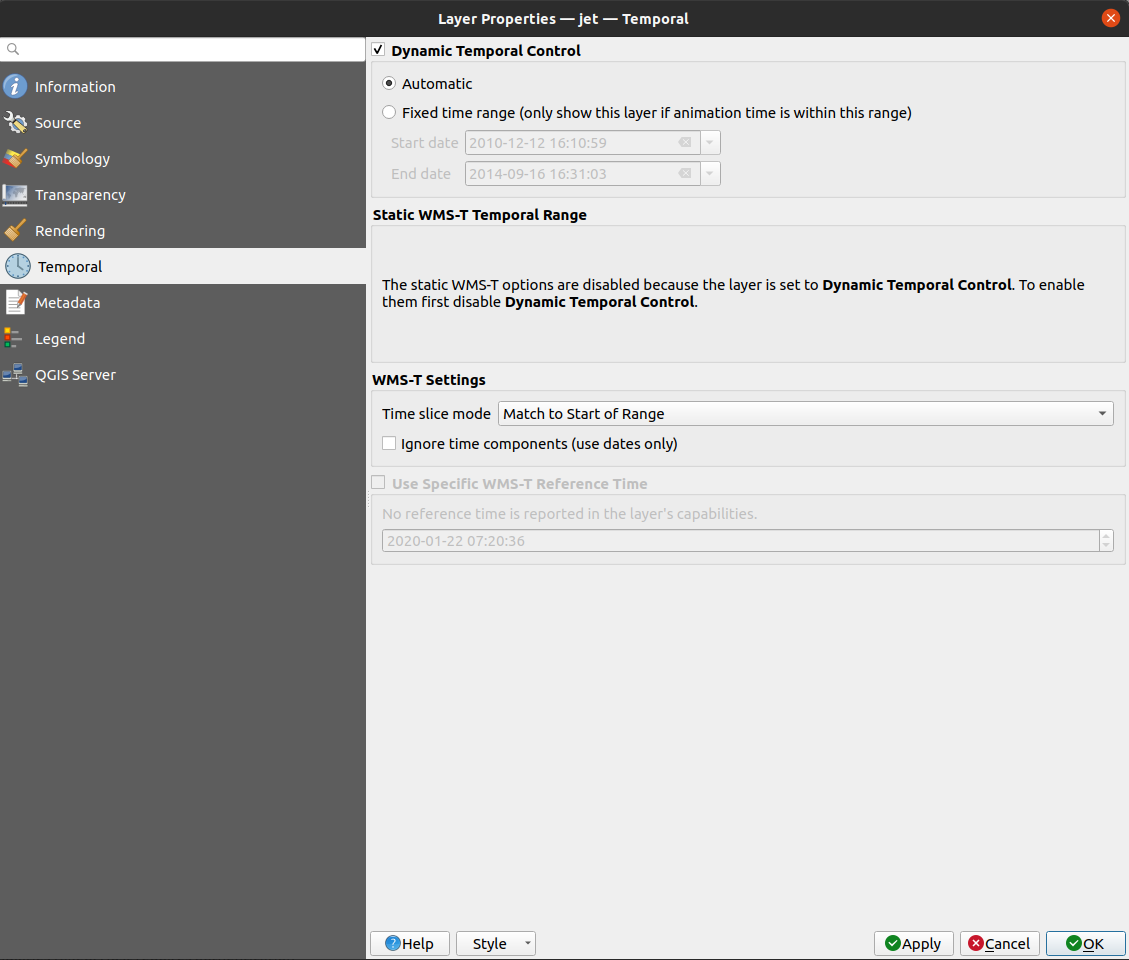
Figure 39 Temporal properties
For performance reasons the View Server lists only start and end of the time interval, in which the collection contains some products. It would not be suitable to list all individual time entries, as there can be easily hundreds of thousands of them. Both QGIS 3.14 and ArcMap 10.4 expect individual time entries listing and then determine its own time related behavior while handling these layers. QGIS 3.14 does not recognize capabilities time interval as time aware layer and does not add the TIME= parameter to the WMS/WMTS query. New versions of QGIS can use the Temporal Controller native functionality and older versions should use the TimeManager plugin to view data from the View Server
Loading in ArcMap 10
Any of the above described layers can be loaded in ArcMap 10, but the inbuilt time support does have the same issues as in the case of QGIS 3.14 Time Controller. Therefore a custom TIME parameter has to be added manually in the Layer settings.
To add a WMS/WMTS layer, click on the Add Layer symbol. Select the Add GIS Server option and follow up with either Add WMS Server or Add WMTS Server, as can be seen on Figure 40, Figure 41, and Figure 42.
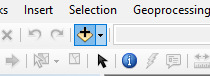
Figure 40 ArcMap Add Data Buttton
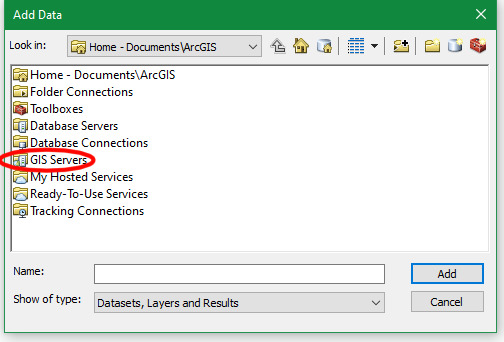
Figure 41 Choose GIS Servers
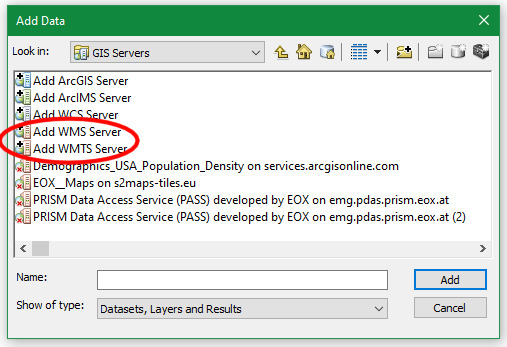
Figure 42 WMS/WMTS loading in ArcMap
Then user is required to insert the service URL and click Get Layers. If the service is secured with some sort of authentication, the user must provide a valid username and password on the login attempt. After they are supplied, the list of available layers appears, as seen on Figure 43, and Figure 44.
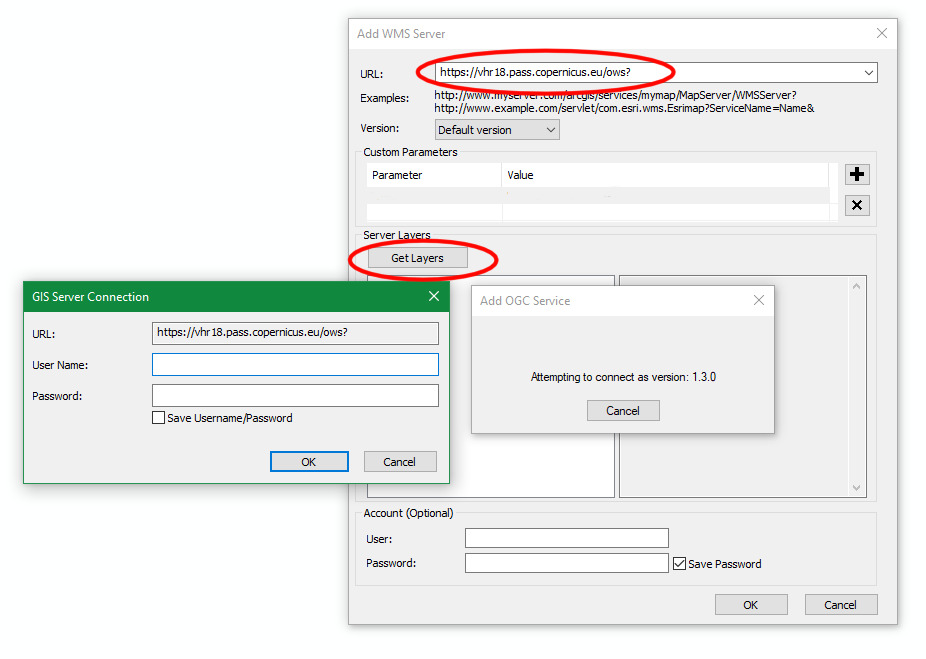
Figure 43 ArcMap add WMS Server panel
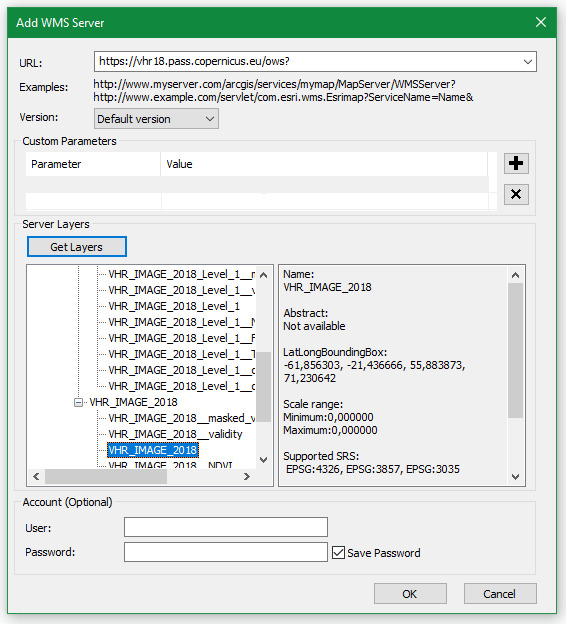
Figure 44 ArcMap add WMS Server panel
This layer then gets added into the list of layers to choose from for adding into the workspace, as seen on Figure 45. A user than follows into the nested structure of sublayers to select the one to explore, as seen on Figure 46, Figure 47, and Figure 48.
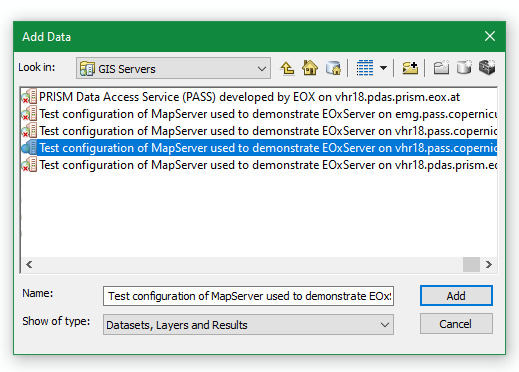
Figure 45 Select layers
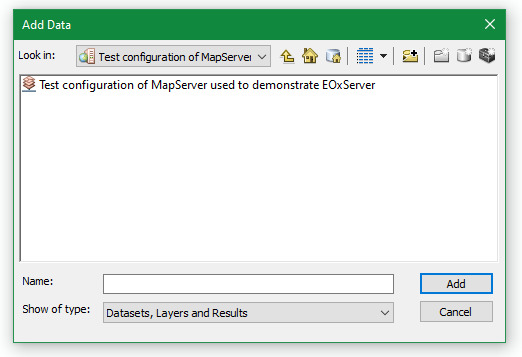
Figure 46 Select layers
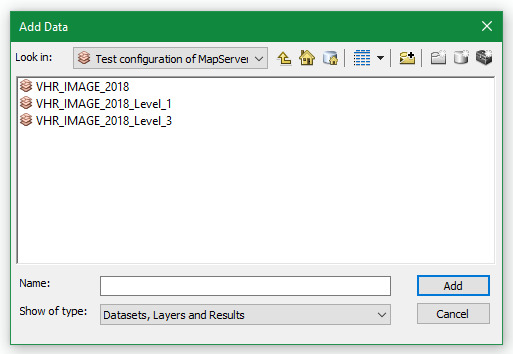
Figure 47 Select layers
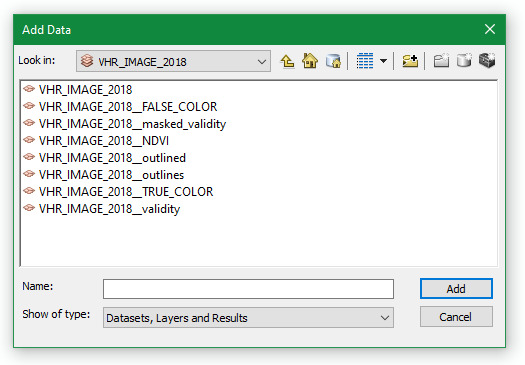
Figure 48 Select sublayers
In order to limit the displayed time interval, a user needs to add the TIME parameter to the requests by accessing Layer Properties, expand the Tab Parameters and enter the time interval as can be seen on Figure 49. If the TIME parameter was already added in the previous step of adding a WMS Server, it can not be added for the request twice and needs to be changed for the whole Data Source.
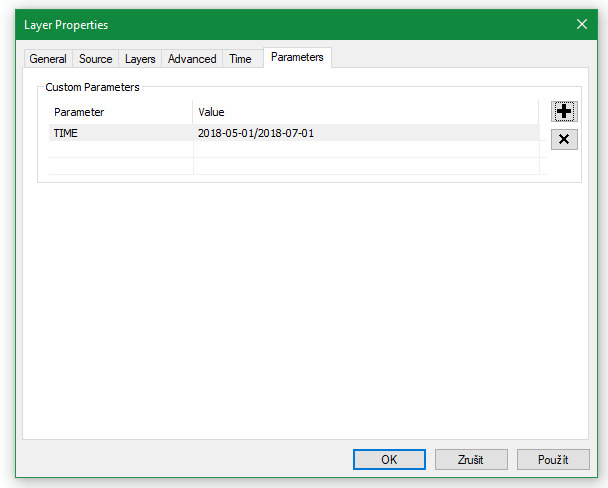
Figure 49 Set custom TIME parameter
Continue reading to learn about the provided Searching services.